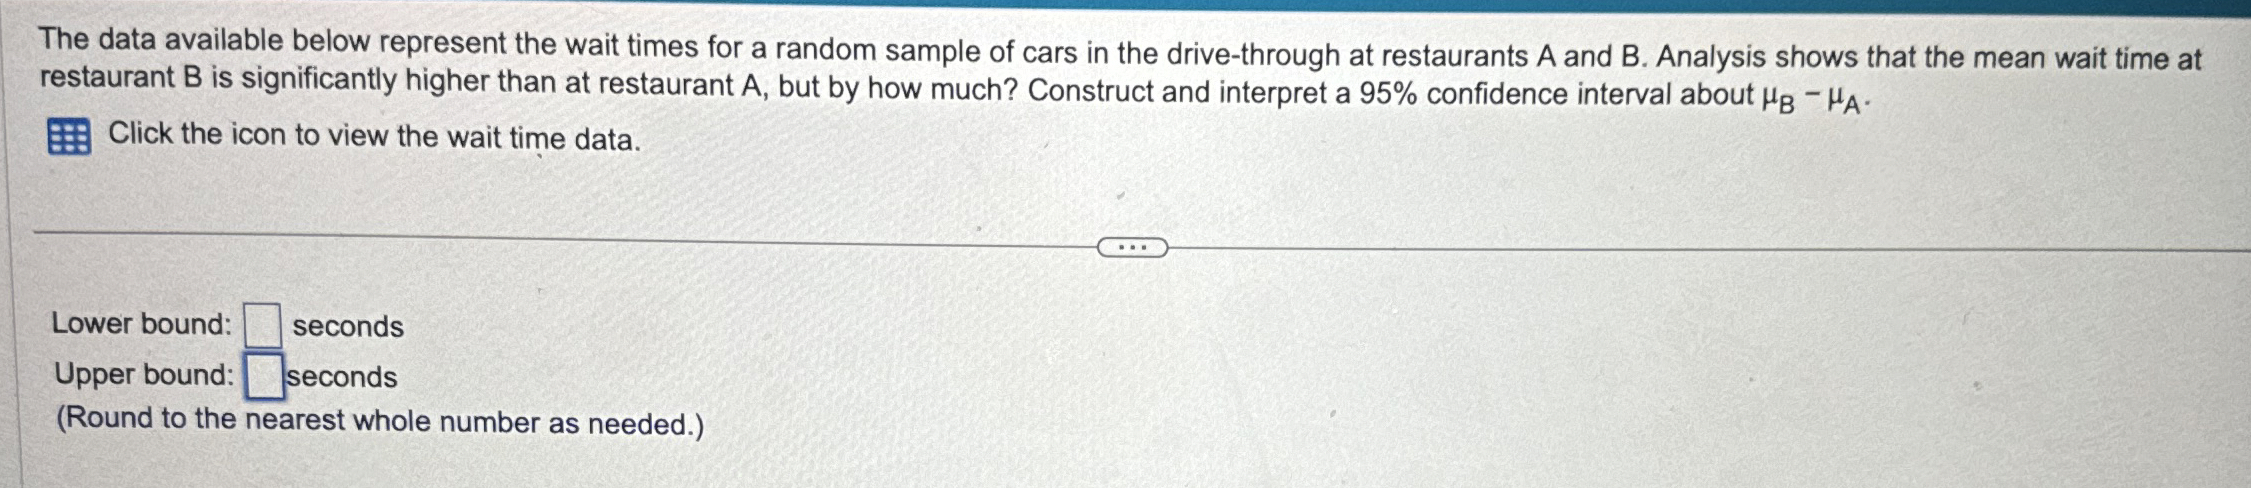
The data available below represent the wait times for a random sample of cars in the drive-through at restaurants
A and
B. Analysis shows that the mean wait time at restaurant
B is significantly higher than at restaurant
A, but by how much? Construct and interpret a
95% confidence interval about
\mu _(B)-\mu _(A).
Click the icon to view the wait time data.
Lower bound:
◻ seconds
Upper bound:
◻ seconds
(Round to the nearest whole number as needed.)