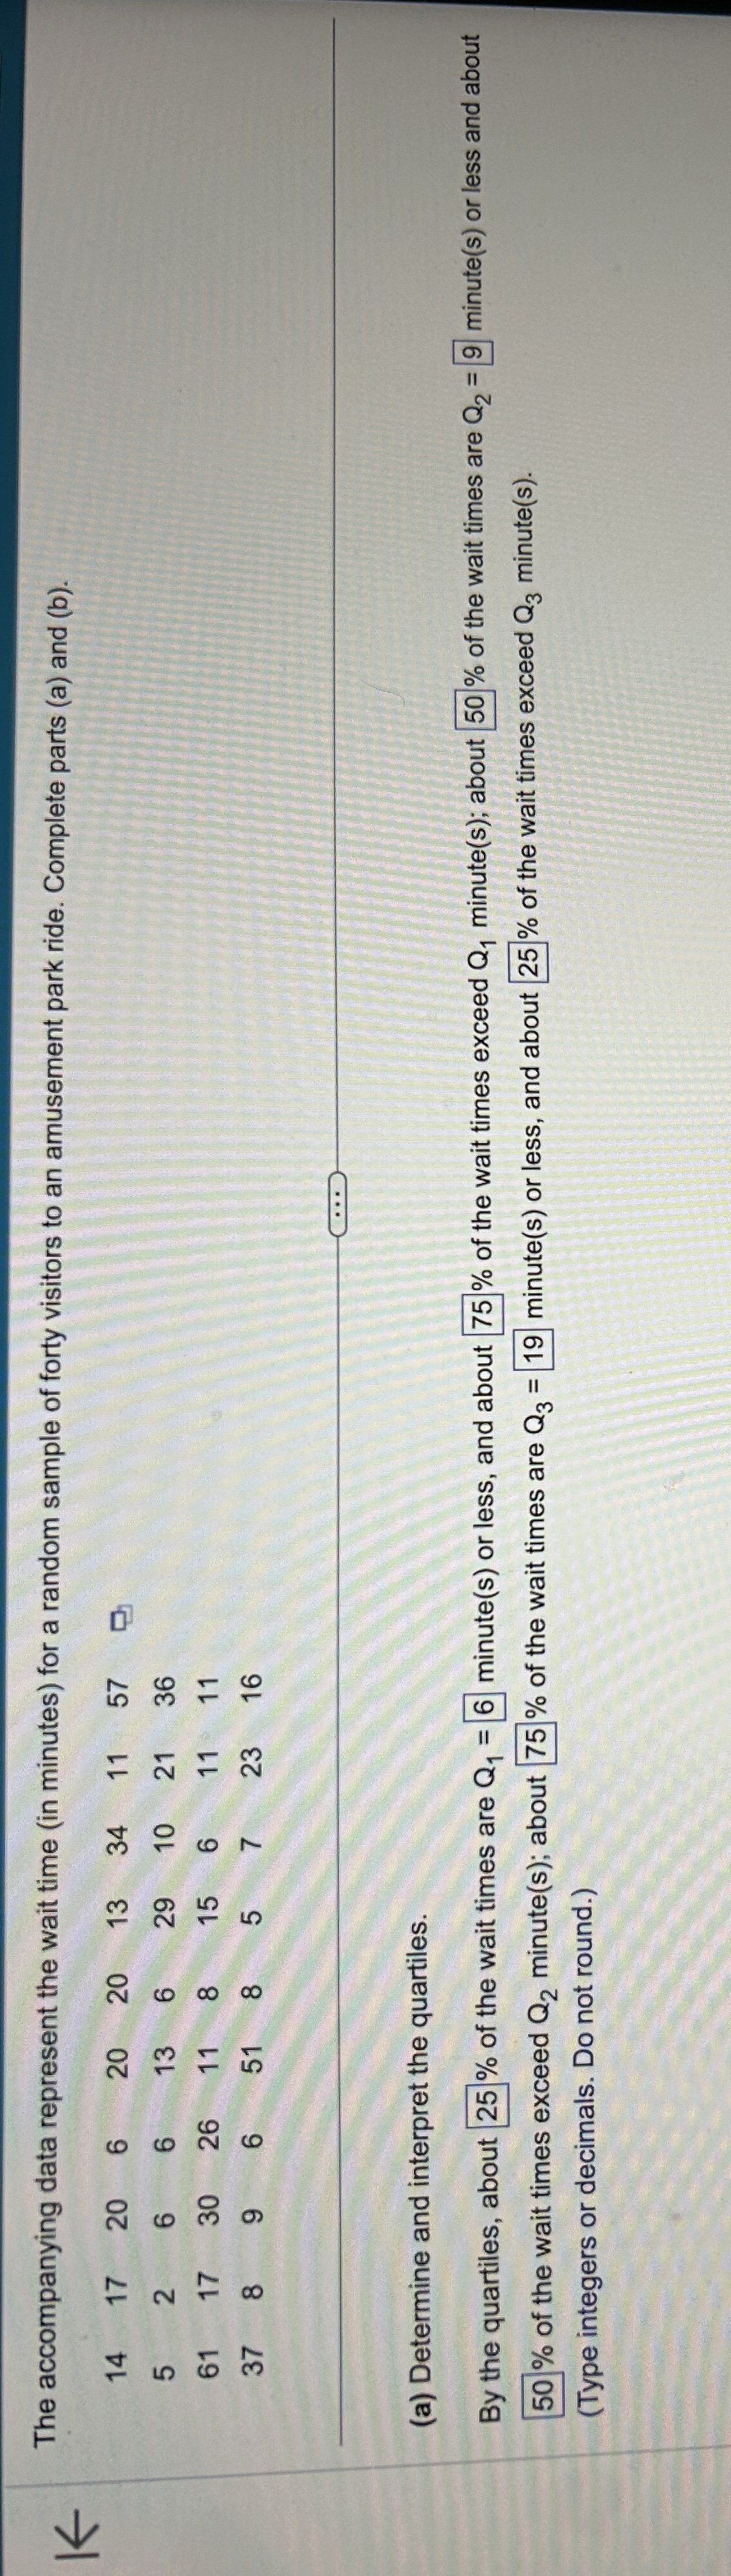
The accompanying data represent the wait time (in minutes) for a random sample of forty visitors to an amusement park ride. Complete parts (a) and (b).
\table[[14,17,20,6,20,20,13,34,11,57],[5,2,6,6,13,6,29,10,21,36],[61,17,30,26,11,8,15,6,11,11],[37,8,9,6,51,8,5,7,23,16]]
(a) Determine and interpret the quartiles.
By the quartiles, about
25% of the wait times are
Q_(1)=6 minute(s) or less, and about
75% of the wait times exceed
Q_(1) minute(s); about
50% of the wait times are
Q_(2)=9 minute(s) or less and about
50% of the wait times exceed
Q_(2) minute(s); about
75% of the wait times are
Q_(3)=19 minute(s) or less, and about
25% of the wait times exceed
Q_(3) minute(s).
(Type integers or decimals. Do not round.)